Note
Click here to download the full example code
Smokes-Friends-Cancer
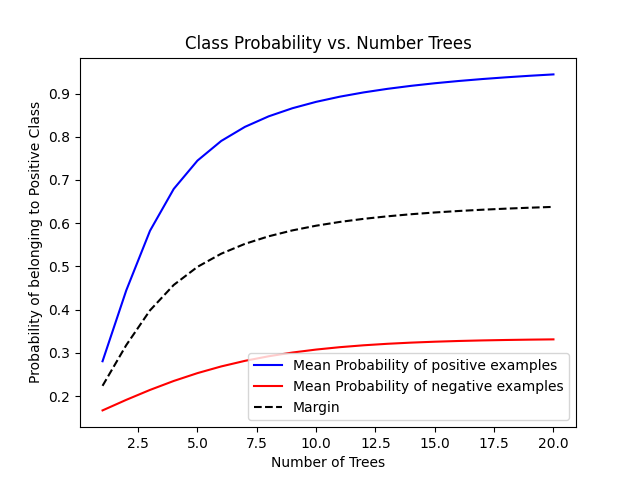
The smokes-friends-cancer example is a common first example in probabilistic relational models, here
we use this set to learn a Relational Dependency Network (srlearn.rdn.BoostedRDN).
This shows how the margin between positive and negative examples is maximized as the number of iterations of boosting increases.
Out:
/home/docs/checkouts/readthedocs.org/user_builds/srlearn/checkouts/stable/srlearn/base.py:70: FutureWarning: solver='BoostSRL' will default to solver='SRLBoost' in 0.6.0, pass one or the other as an argument to suppress this warning.
  ", pass one or the other as an argument to suppress this warning.", FutureWarning)

<matplotlib.legend.Legend object at 0x7f040d75e750>
from srlearn.rdn import BoostedRDNClassifier
from srlearn import Background
from srlearn.datasets import load_toy_cancer

import numpy as np
import matplotlib.pyplot as plt

train, test = load_toy_cancer()

bk = Background(modes=train.modes)

clf = BoostedRDNClassifier(
    background=bk,
    target="cancer",
    max_tree_depth=2,
    node_size=2,
    n_estimators=20,
)

clf.fit(train)

x = np.arange(1, 21)
y_pos = []
y_neg = []
thresholds = []

for n_trees in x:
    clf.n_estimators = n_trees
    probs = clf.predict_proba(test)

    thresholds.append(clf.threshold_)
    y_pos.append(np.mean(probs[np.nonzero(clf.classes_)]))
    y_neg.append(np.mean(probs[clf.classes_ == 0]))

thresholds = np.array(thresholds)
y_pos = np.array(y_pos)
y_neg = np.array(y_neg)

plt.plot(x, y_pos, "b-", label="Mean Probability of positive examples")
plt.plot(x, y_neg, "r-", label="Mean Probability of negative examples")
plt.plot(x, thresholds, "k--", label="Margin")
plt.title("Class Probability vs. Number Trees")
plt.xlabel("Number of Trees")
plt.ylabel("Probability of belonging to Positive Class")
plt.legend(loc="best")
Total running time of the script: ( 0 minutes 13.920 seconds)